home
***
CD-ROM
|
disk
|
FTP
|
other
***
search
/
PDR Electronic Library 2001 2AX
/
PDR Electronic Library 2001 2AX.iso
/
Data
/
Pdr
/
Images
/
70
/
40202002.JPG
< prev
next >
Tile
Joint Photographic Experts Group Image
|
2001-05-31
|
31.8 KB
|
480x553
|
8-bit (256 colors)
similar images
ocr:
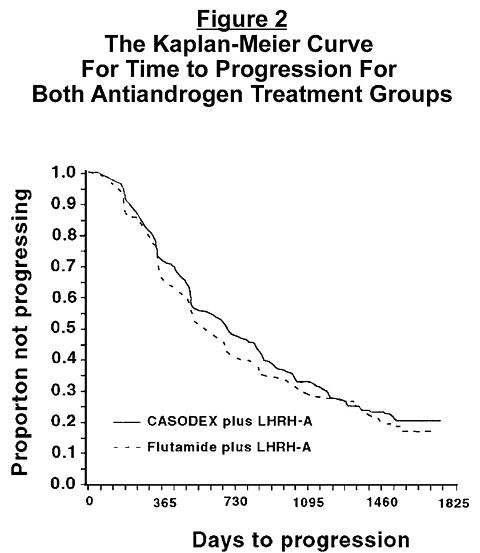
Figure 2 The Kaplan-Meier Curve For Time to Progression For Both Antiandrogen Treatment Groups 1.0 0.91 - 3 $ 0.8- - 0.7 0.6 0.5 0.4. 0.3 0.2 CASODEX plus LHRH-A 0.1 - Flutamide plus LHRH-A 0.0 0 365 730 1095 1460 1825 Days to progression